USA Election Tracker: Live Results Built for Election Night

A live election night board for the 2026 midterms. It shows the Senate, the House and the governor races on one page, with betting market odds mixed in. My own product at usaelectiontracker.com. I was the product owner, designer and builder.
Year
2026
Scope
Product strategy, Data design, Full-stack development, Data visualization, Plain-language writing, Live operations
Timeline
Built in days, live on election night
Prototype Snippit
Preview
Plus icon
USA Election Tracker Senate board on a laptop, showing the seat count and the US map

Make or Break:

One Page for the Big Question

Election night is confusing. The news sites are full of ads. Each network calls races at a different time. You end up flipping between tabs to figure out what is going on.

I wanted to watch the 2026 midterms on my own board. So I built one. It answers the big question fast. Who is going to control the Senate? Then you can click any state and get the full story.

USA Election Tracker is my own product. I built it on the same stack I use for clients: Lovable and React, with Supabase holding the data.

Two phones showing the Senate and House boards side by side
House results scoreboard and map on a laptop
Mechanism 1:
From the Big Score Down to Your District

Problem. Most results pages show you a wall of numbers. You have to do the math yourself to know who is winning. And if you want your own House race, you have to dig for it.

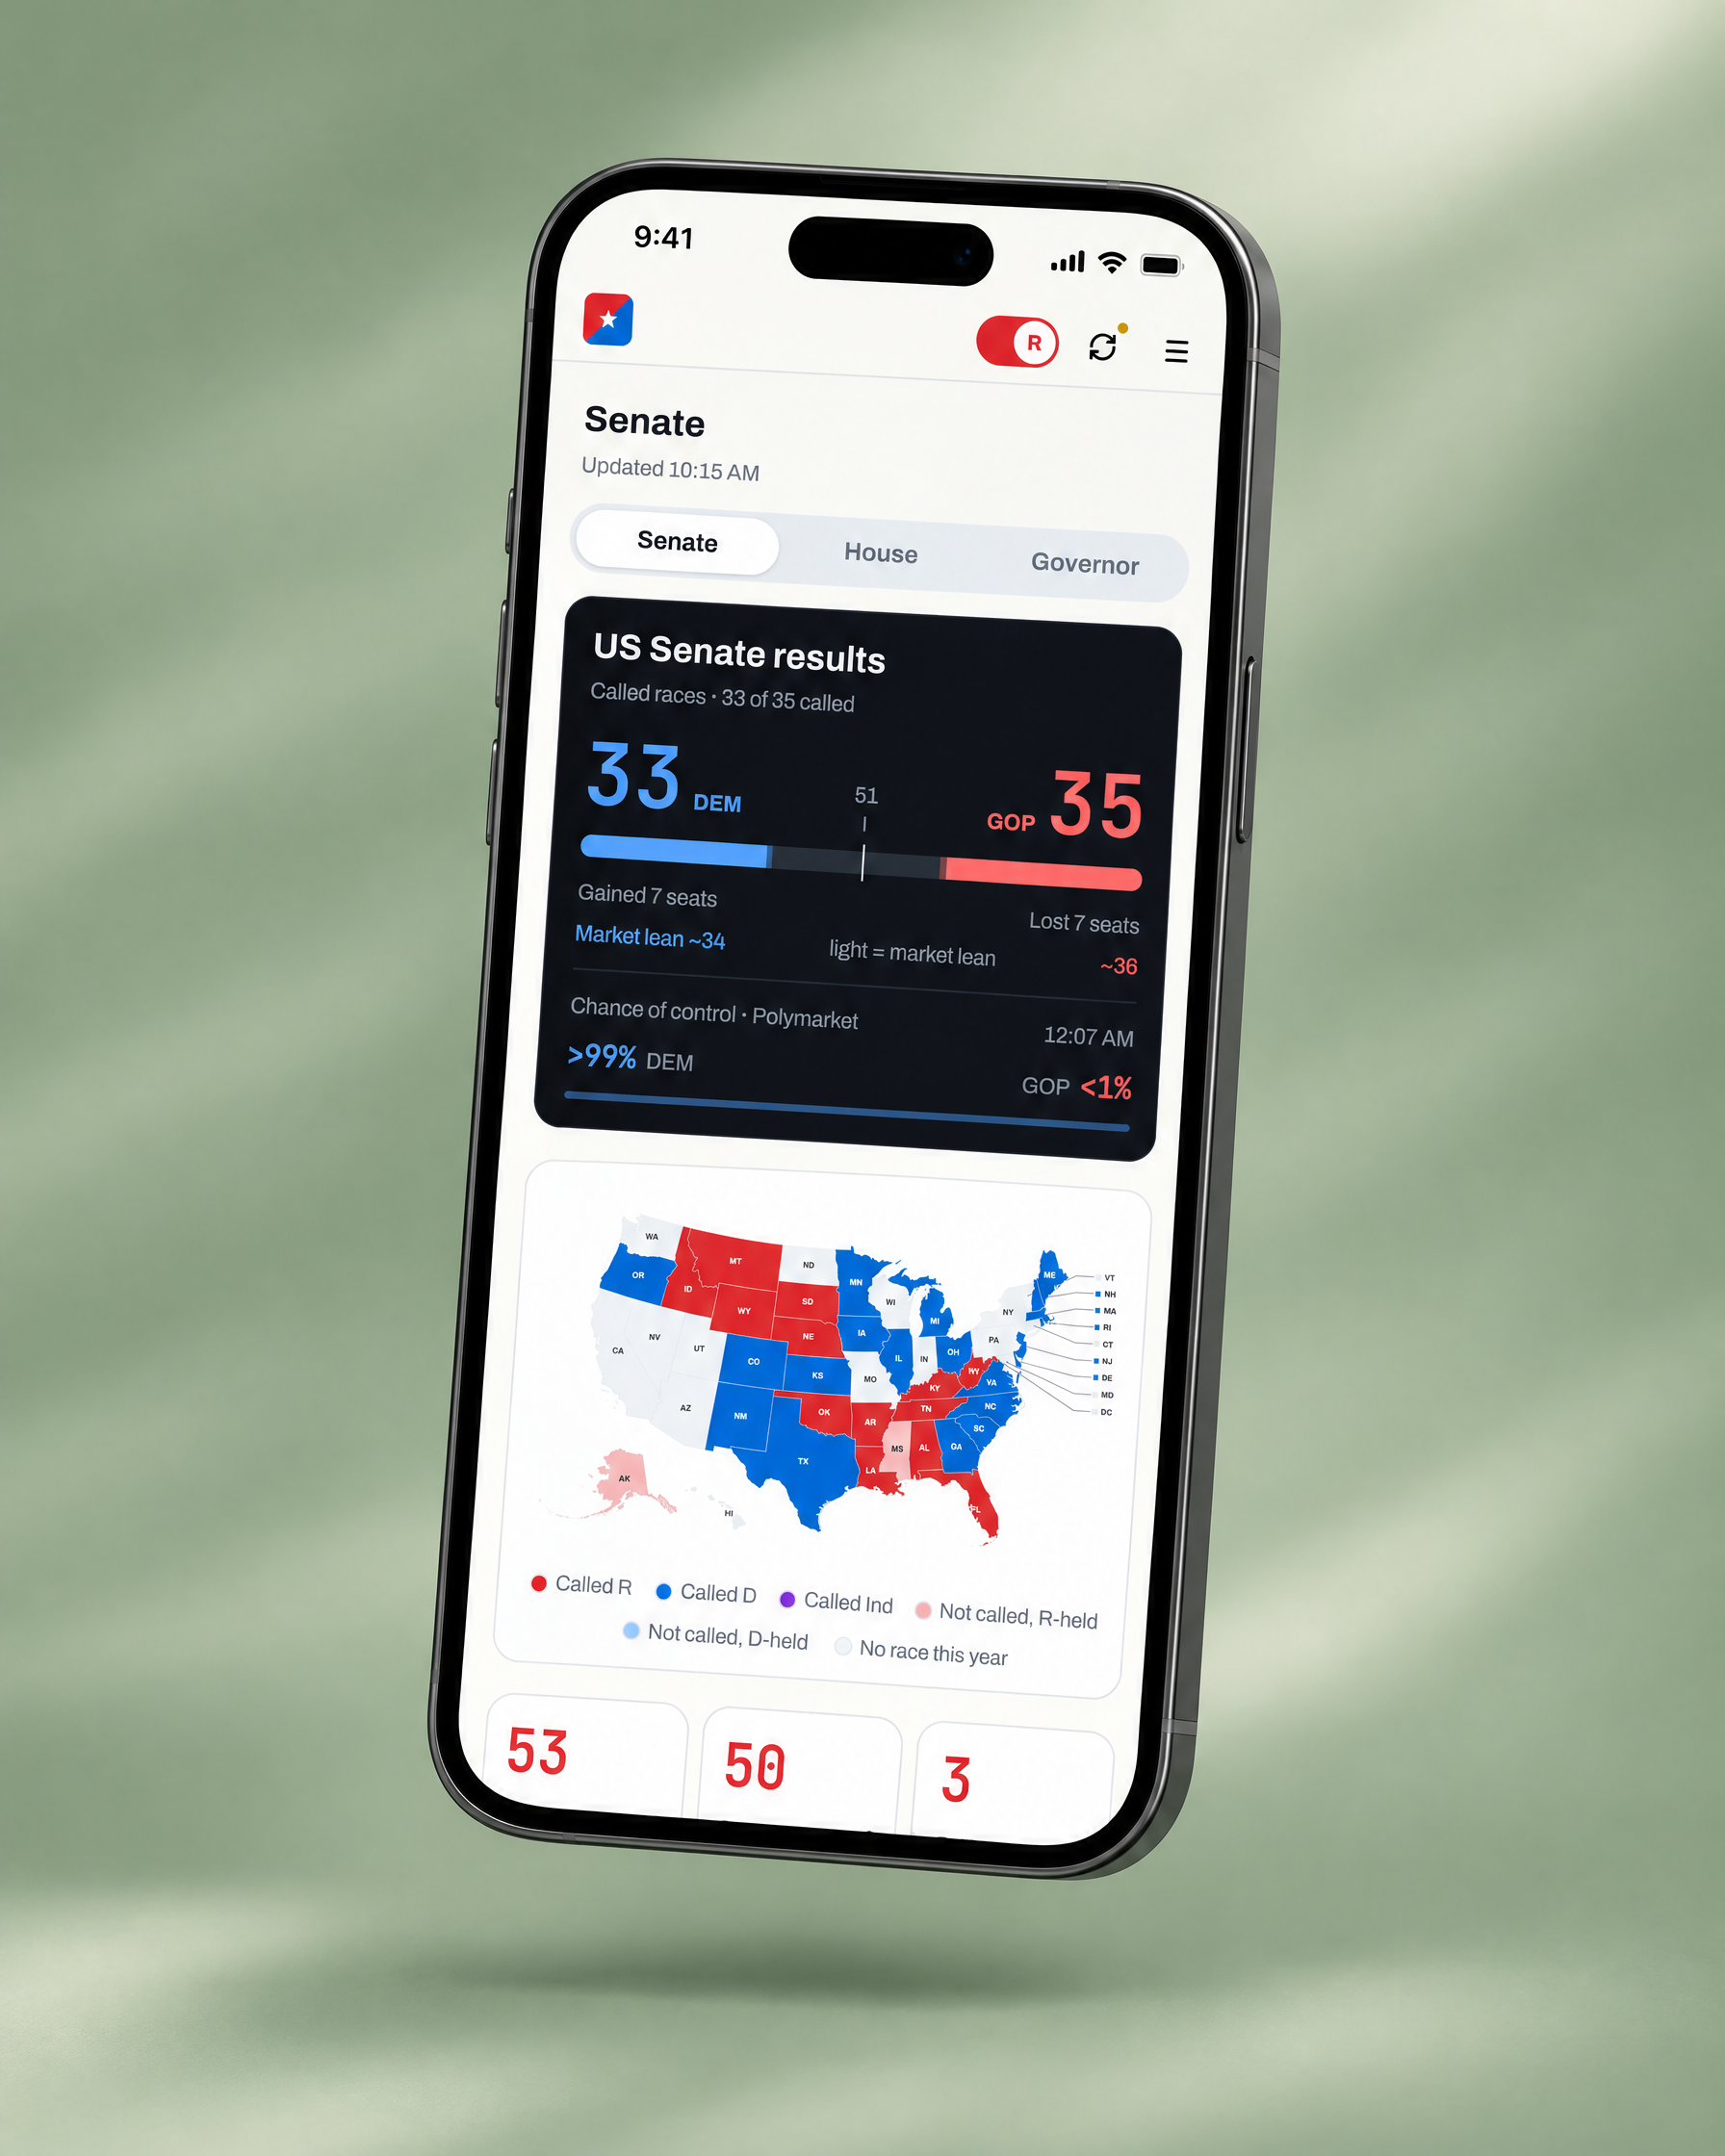
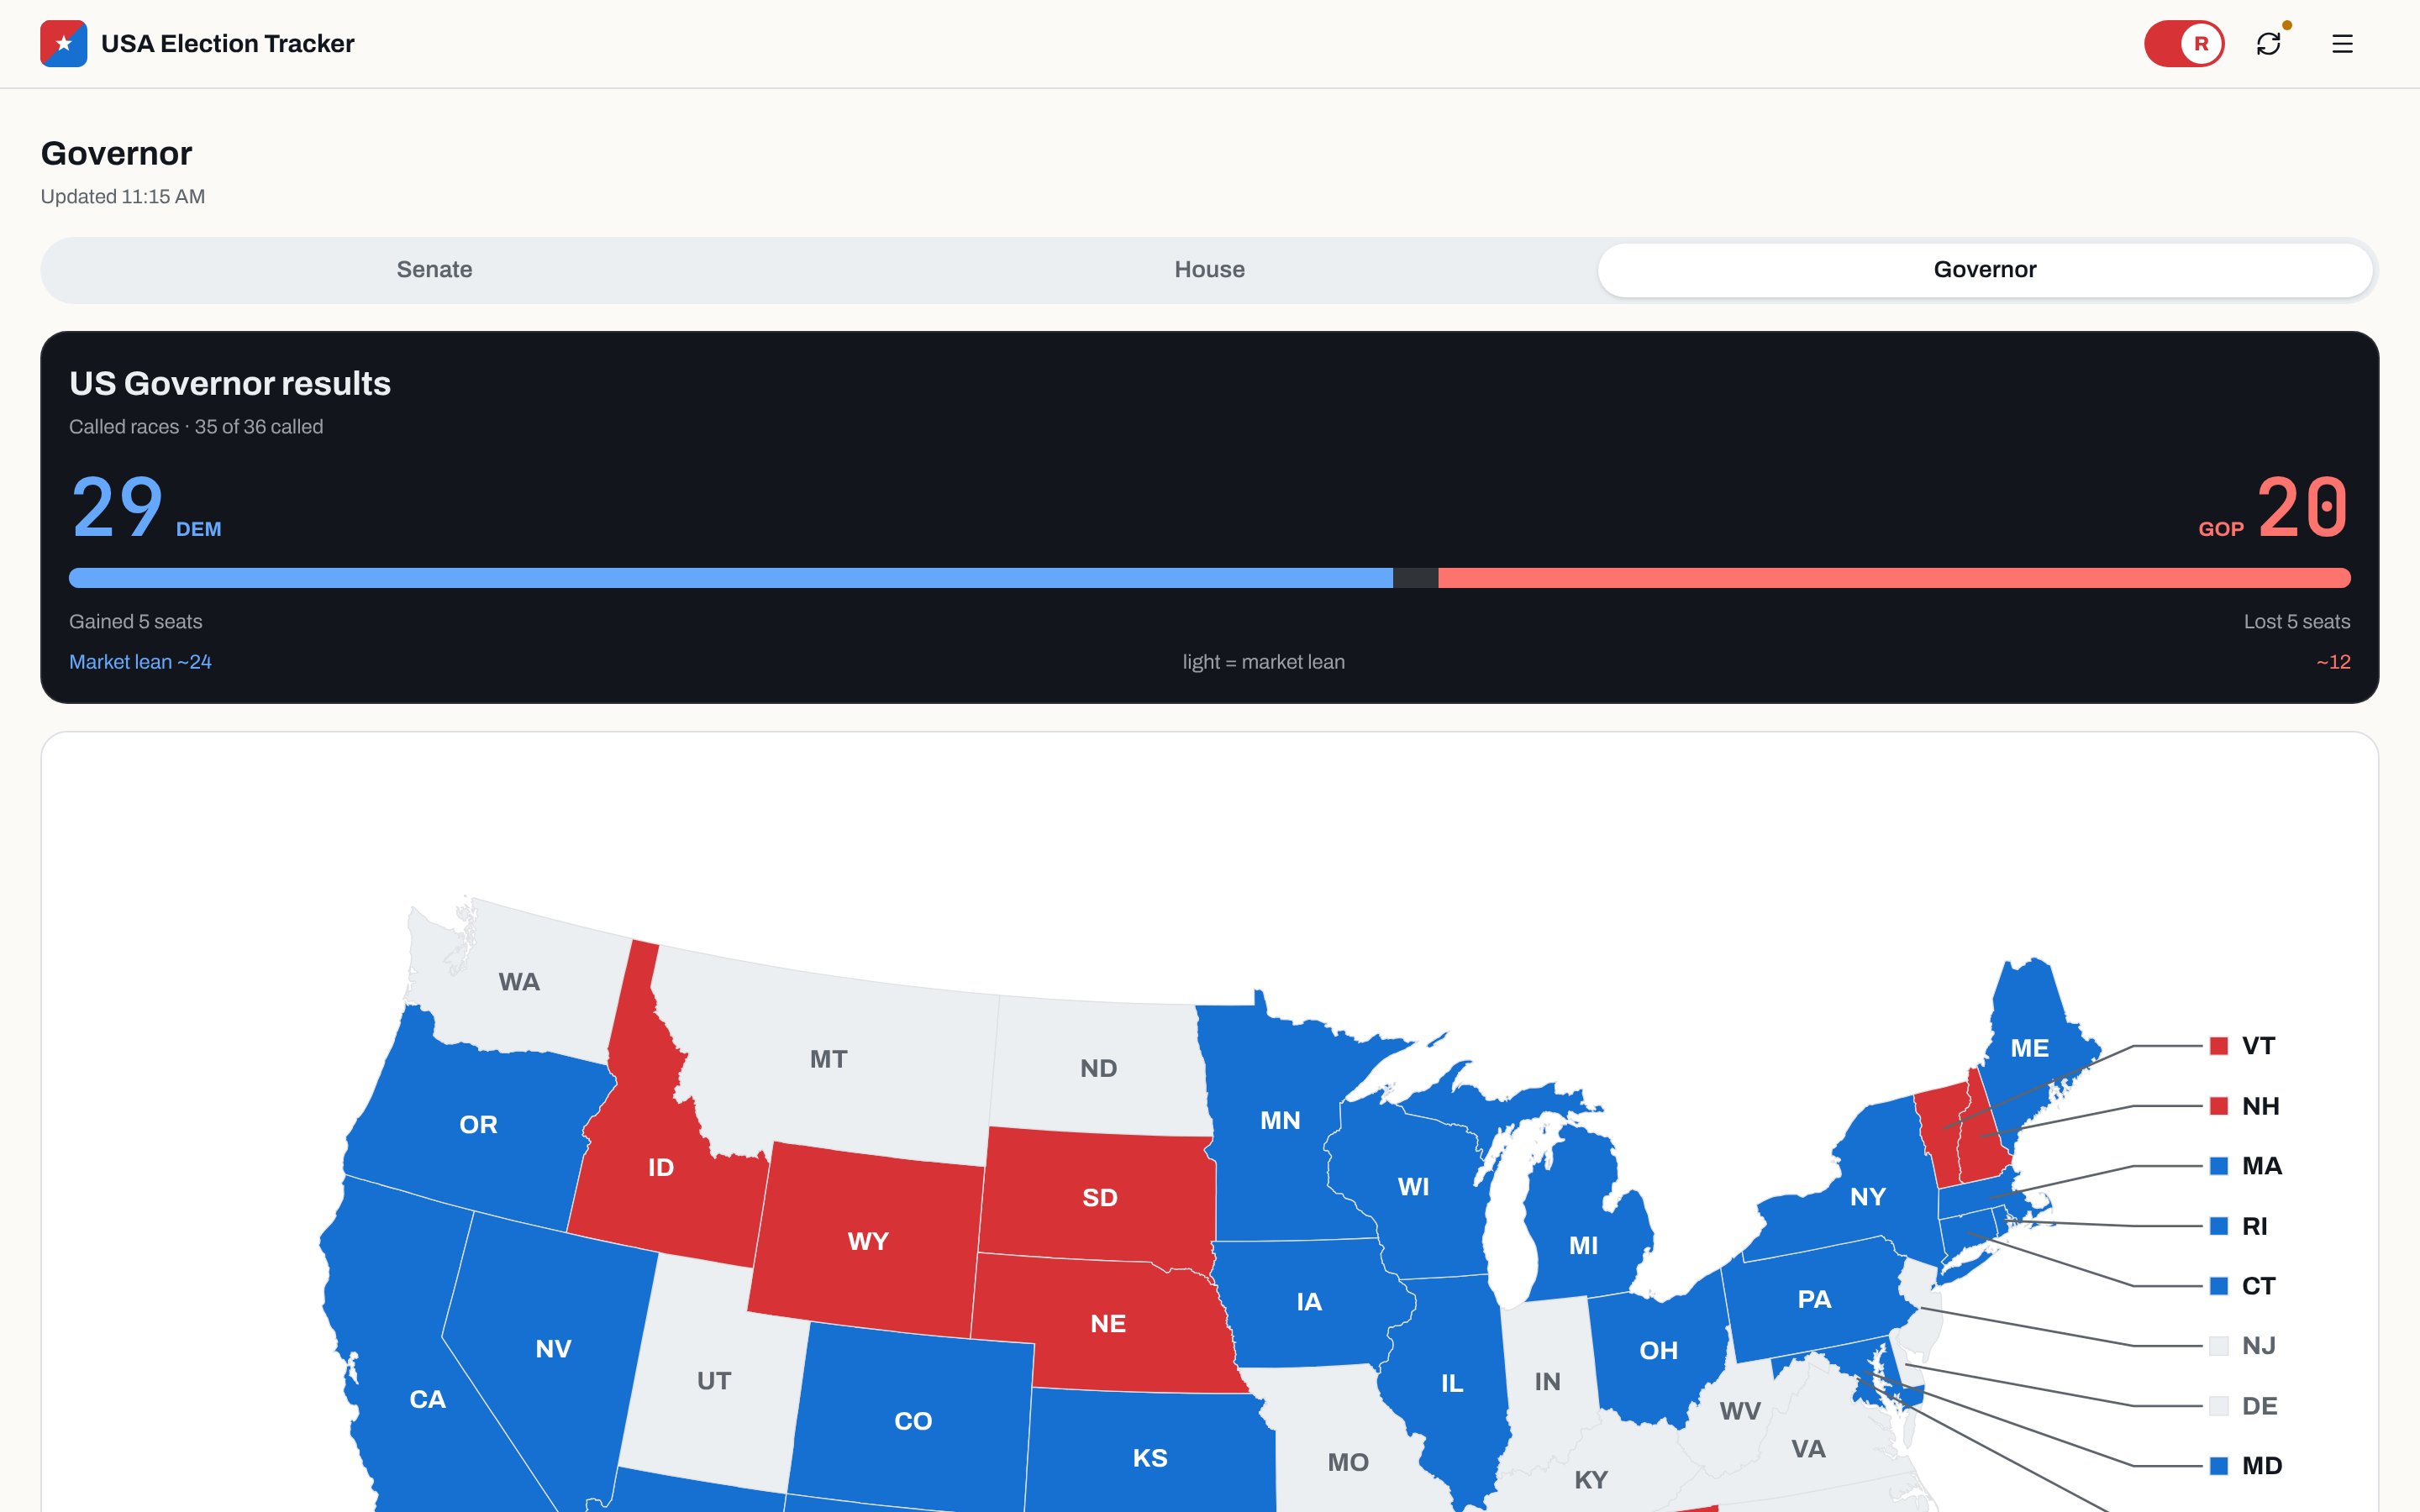
Mechanism. The top of the board works like a sports score. Blue is on the left. Red is on the right. A line in the middle shows how many seats it takes to win. The bright part of the bar is races that are called. The faded part is where the markets think the rest will land.

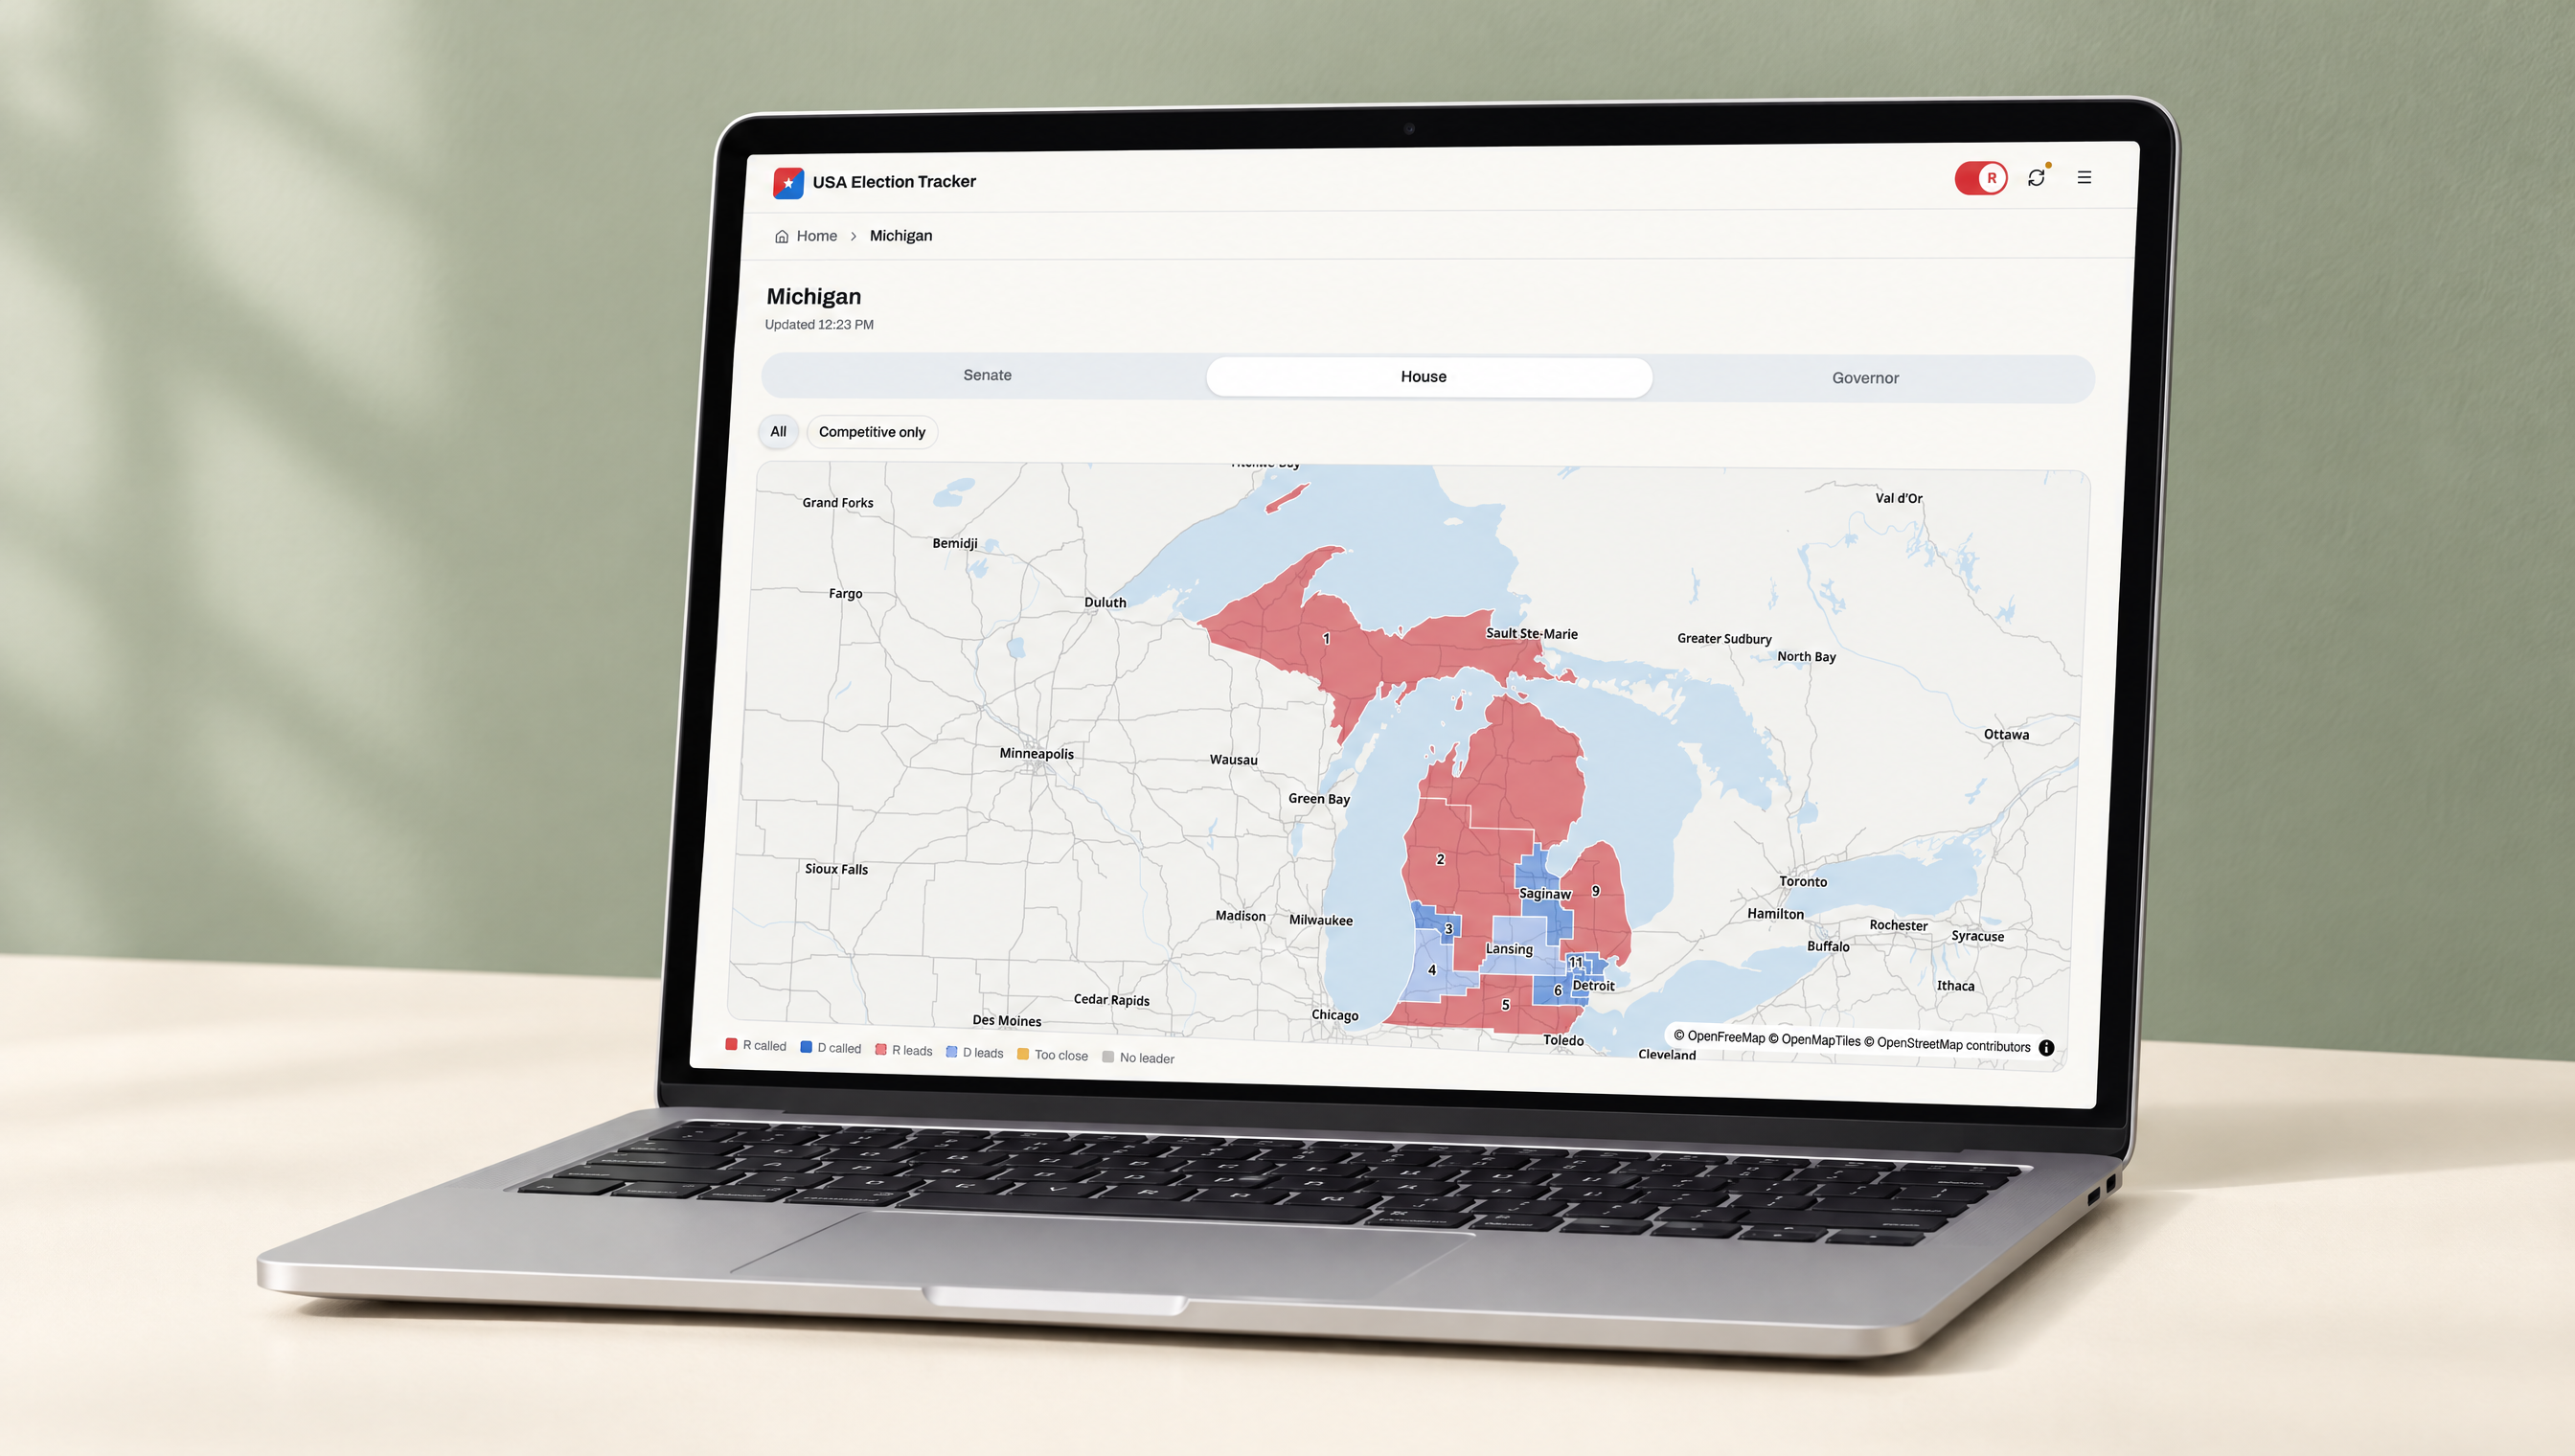
From there you can zoom all the way in. Every state has a real district map, drawn with the 2026 lines. Each district is colored by who won or who is ahead. Tap a district and you land on that race.

Product expression.
  • A dark scoreboard card with seats won, seats gained and the number needed to win
  • A national map where dark means called, light means leaning and grey means no race this year
  • District maps for every state, built on real boundaries with a street map underneath
  • A "Competitive only" filter that hides the safe seats, plus a tile view of every district
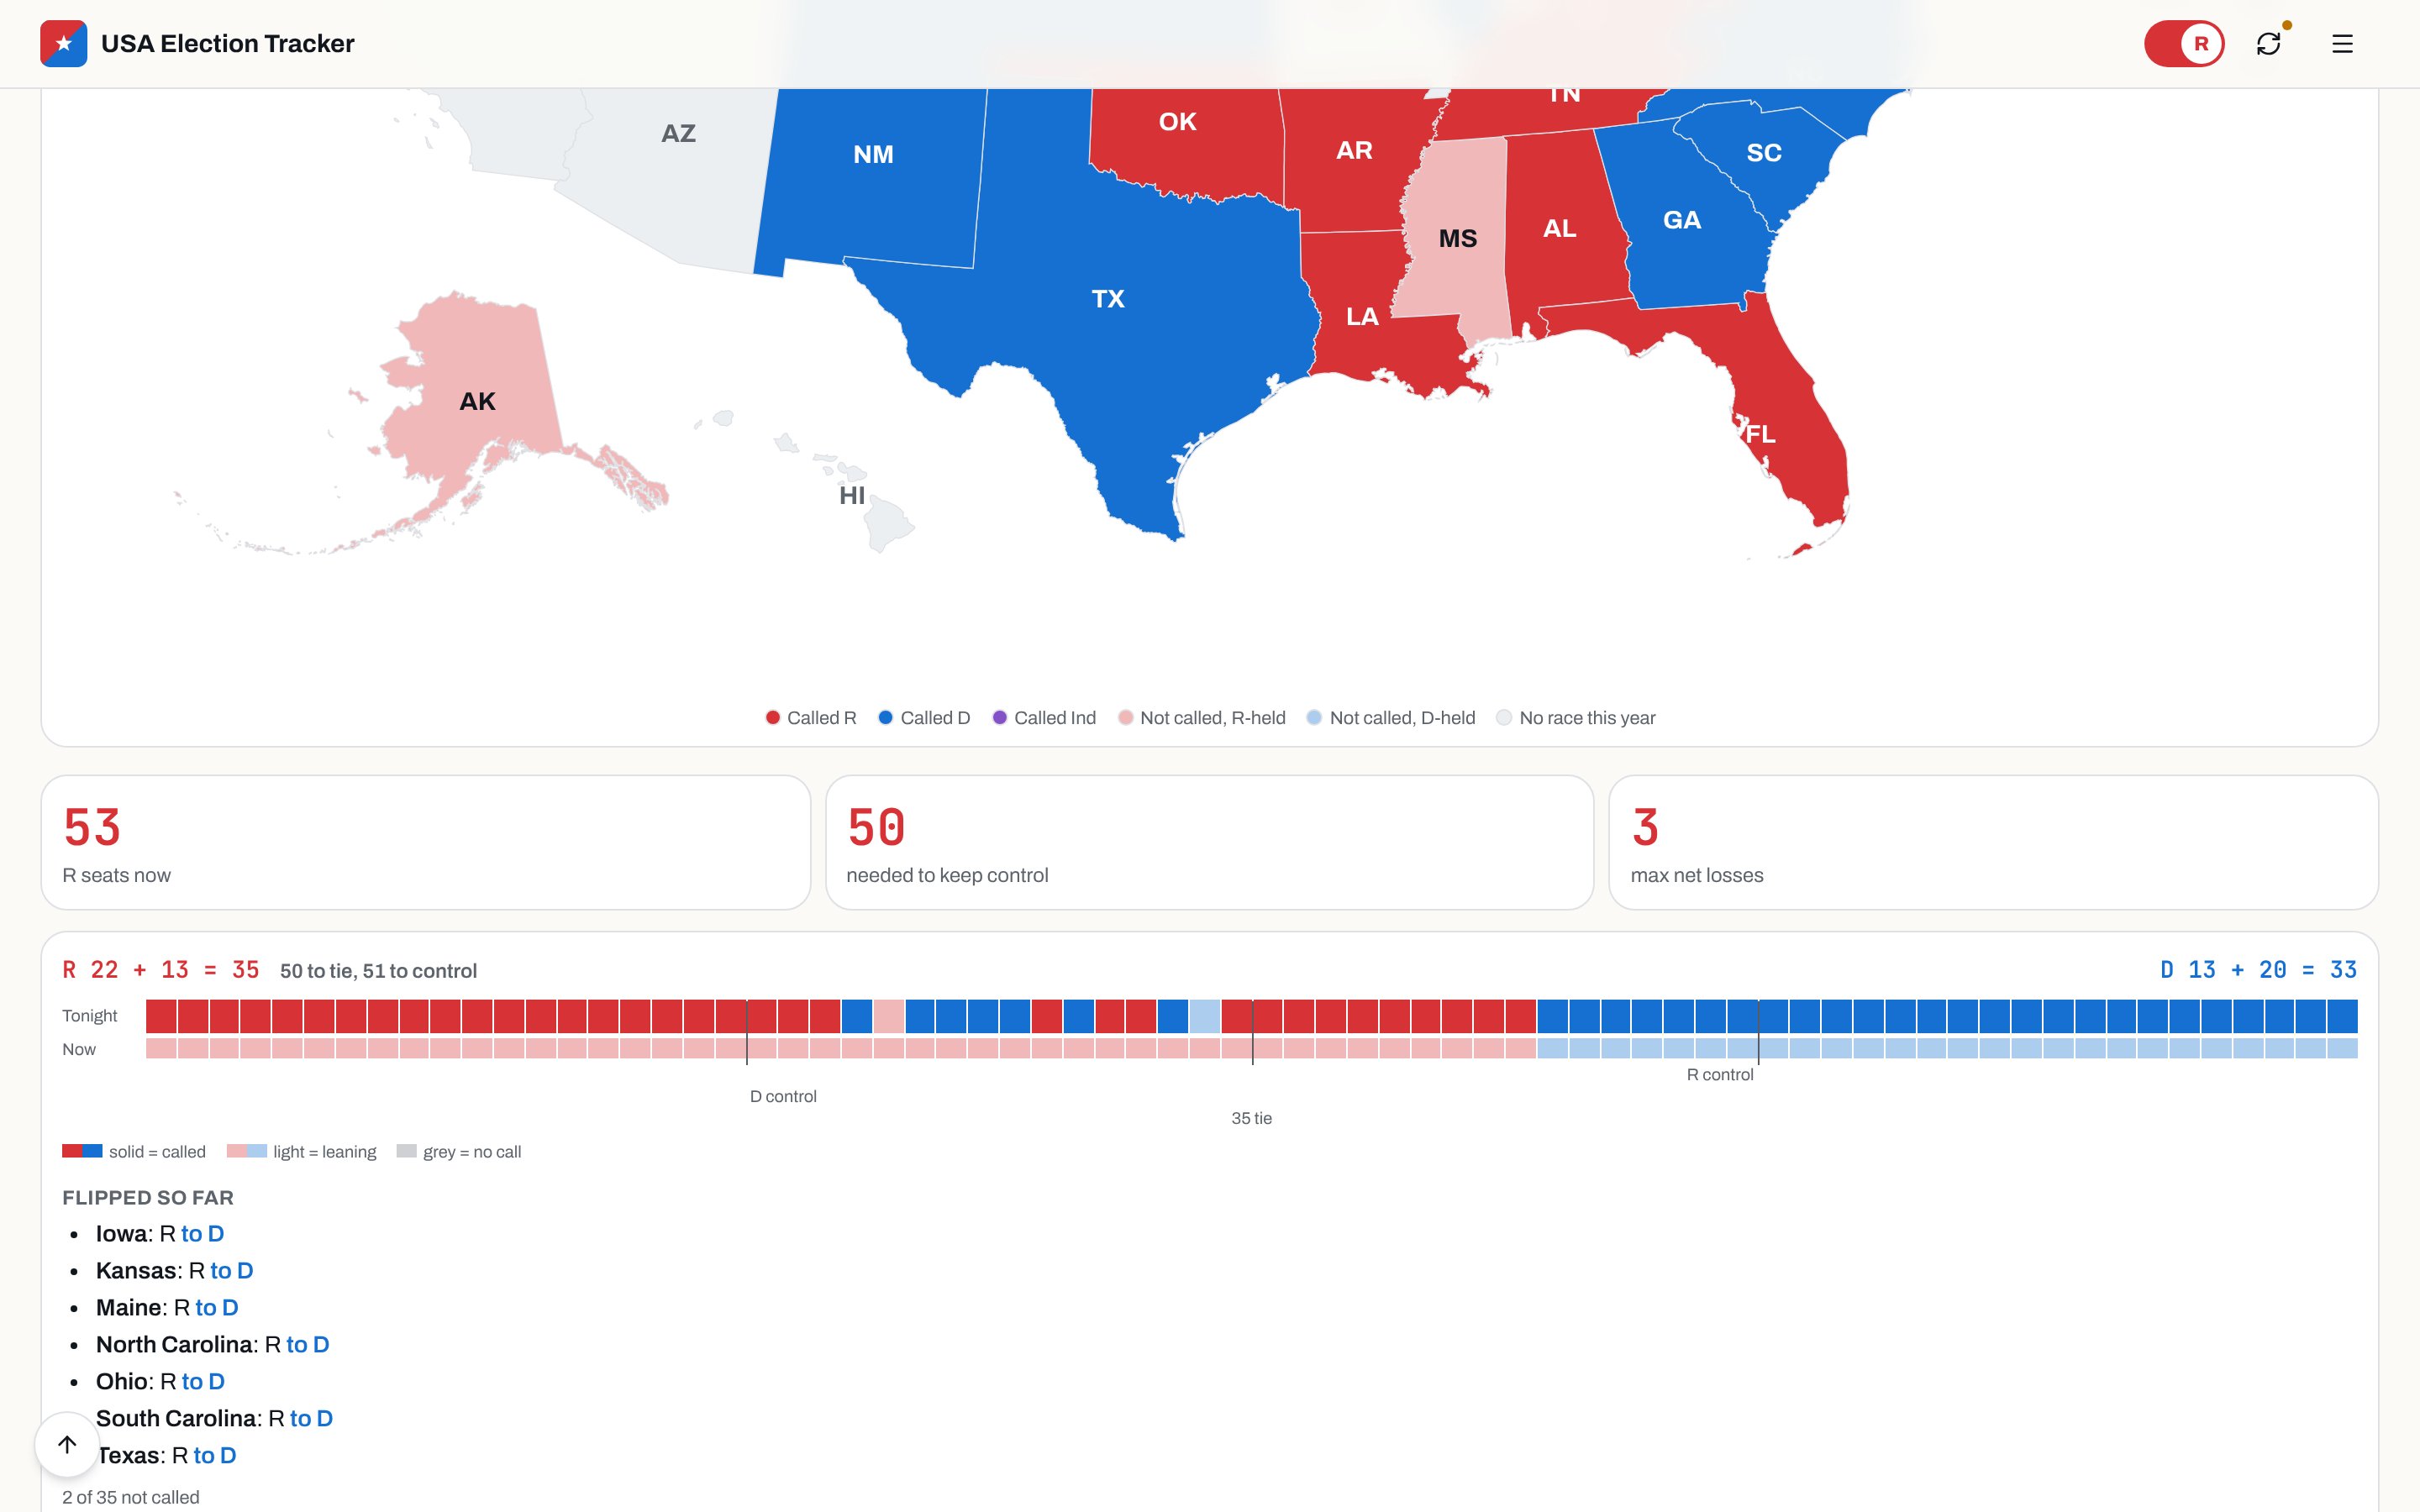
  • A page for all 435 House districts, with a running list of seats that flipped
  • A red and blue switch that flips the whole board to one party's point of view
Michigan House district map on a laptop, with each district colored by who won or leads
Senate board on a phone with Polymarket chance of control
Mechanism 2:
Calling Races Before the Networks

Problem. Polls are a guess made weeks ago. The networks wait a long time to call a race. On election night you want to know now.

Mechanism. The app mixes in Polymarket odds. Before votes come in, the odds count a lot. Once a race is called, they stop counting for that race. When the market gives a candidate 97% or more, the app makes its own call. That is a lower bar than the networks use, and that was the point. If a call turns out wrong, it can flip.

Product expression.
  • Each candidate's market chance shown right under their name
  • A chance of control line for the Senate and the House
  • Solid pills for network calls and hollow pills for the app's own early calls
  • An hourly update during the day that pushes new calls and vote counts into the database
  • Updates that stop at night and stop for good once the races are settled
Seat count tiles and the tonight versus now seat bar with the list of flipped seats
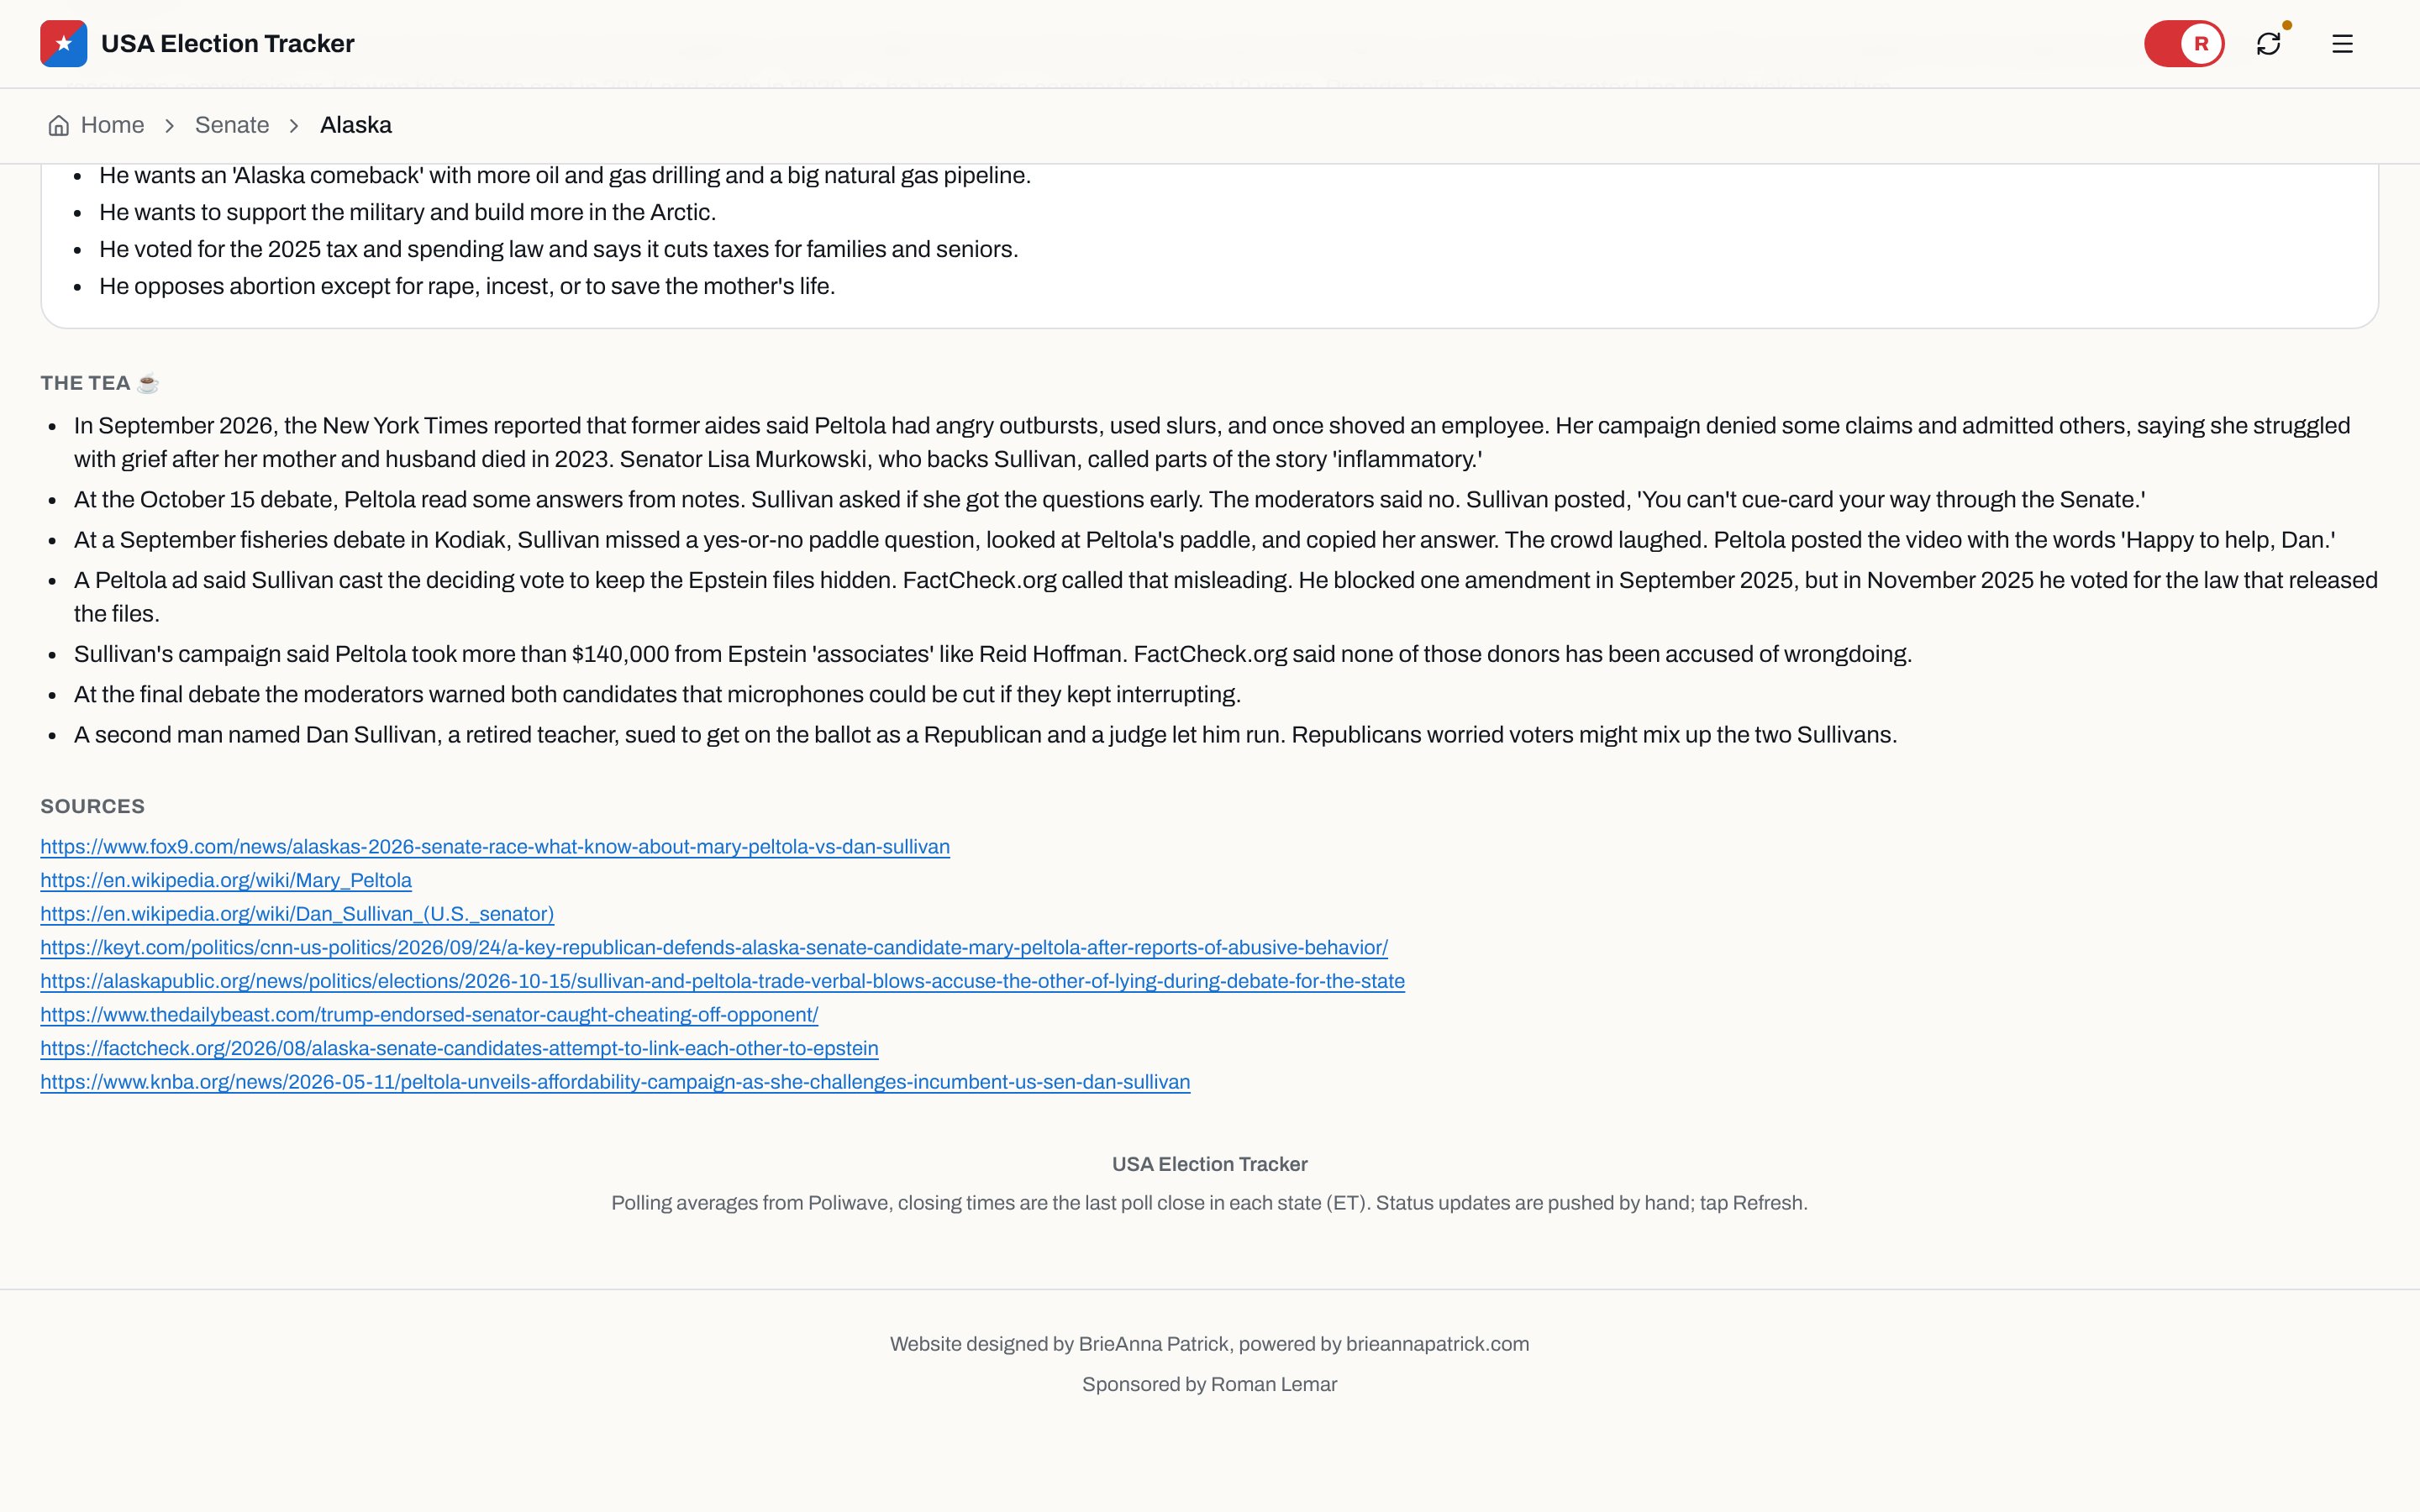
The Tea section on the Alaska race page with campaign trail stories and a list of sources
Mechanism 3:
Know Who's Running, Plus the Tea

Problem. Election coverage is full of jargon. If you don't follow politics every day, you might not know who the candidates even are. And the stories people talk about at dinner are spread across a dozen news sites.

Mechanism. Every race and every district has its own page. Each candidate gets a short, plain bio and a list of what they say they will do. Under that is a section called The Tea. It covers the drama from the campaign trail, like debate moments and attack ads, and it links every source so you can check it. If an ad stretched the truth, The Tea says so and names the fact checker.

You can also skip the maps and just search. Type a state or a candidate's name and you get their vote share and whether they won.

Product expression.
  • Candidate cards with vote share, market odds, a plain bio and their promises
  • The Tea on each race page, with a sources list at the bottom
  • Search by state, abbreviation or candidate name from the menu
  • A how-it-works section that explains the math in everyday words
  • A phone-first layout with one menu button and a logo that takes you home

Outcomes & Signals

What Changed

  • A live results board at usaelectiontracker.com, built in days and running on election night.
  • Senate, House and governor boards on one data model, with a page for every race and all 435 House districts.
  • District maps for every state, drawn on the real 2026 boundaries.
  • Candidate bios and The Tea on every race, with sources linked.
  • Market odds mixed into the forecast, with the app making its own early calls.
  • Hourly updates that kept the board current the day after, while close races were still being counted.
Governor results board
No items found.

This system reflects real operational constraints, tradeoffs, and scale decisions. I’m always open to discussing the thinking behind it.

More projects.